Volume to sell: offer below P50 in uncertain hours rather than betting blindly on the median.

Forecasts for route-to-market.
Not one line, but three
For wind and solar aggregators: P10, P50 and P90 for every 15 minutes, sent via API straight to your trading system. Even for new assets with no track record.
Less room for error, more risk
573 hours
with negative electricity prices in 2025; previous year: 457 (BNetzA)
15 minutes
a negative price, and new installations lose the market premium (Section 51 of the EEG)
96 quarters of an hour
per day, each billed separately to reBAP
PROBABILISTIC FORECASTS
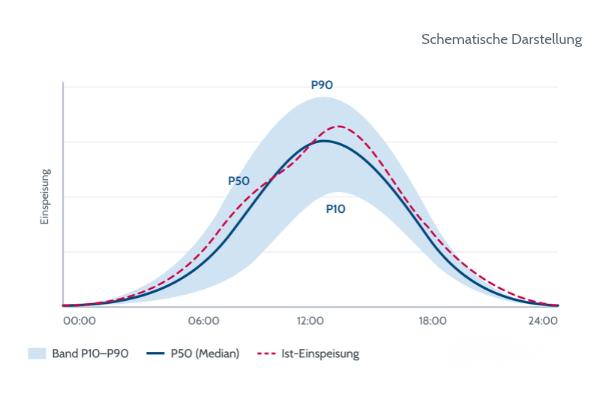
P10, P50 and P90: three curves to manage your risk
mP Xnergy delivers three values for every quarter-hour:
- P10: the realistic lower bound. Generation falls below it in only about one in ten cases.
- P50: the median, the standard forecast you know today.
- P90: the realistic upper bound. Generation exceeds it in only about one in ten cases.
How to read the band: narrow means the forecast is reliable. Wide means this is where the risk lies, for example when it is unclear when a cloud front will pass through.
NEW ASSETS FROM DAY ONE
No track record? No reason to fly blind.
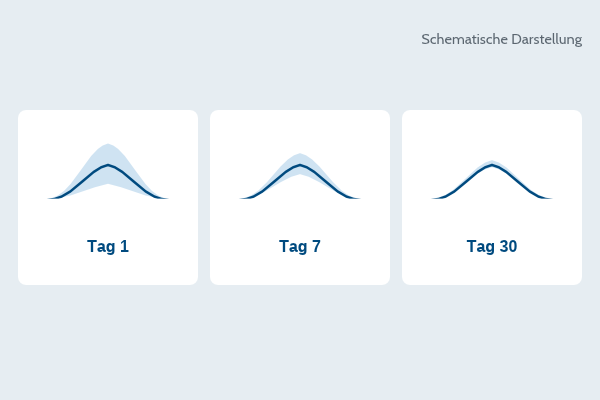
When you commission new plants, the measurement data on which traditional forecasting models rely is missing. mP Xnergy provides forecasts from day one and learns from every measurement. The margin of error narrows day by day.
The mP Simulator calculates in advance how the forecasting accuracy of a new plant will develop. This enables you to plan risk buffers even before commissioning.
Forecast quality
How to recognise a good probabilistic forecast
A trading strategy is only as good as its performance over many quarter-hours. A backtest using your historical data will show whether this is the case. This also allows you to compare forecasting providers fairly.
Too optimistic
Actual values fall outside the band more often than P10 and P90 suggest. Your risk is underestimated.
Honest and precise
Around 8 in 10 actuals fall within the band. You can base your trading and limits on that.
Too
cautious
Hardly anything falls outside, but the band is too wide to guide any decision.
How it works
From weather forecast to schedule submission: one automated process
Weather data
Whenever weather forecasts are updated, mP Xnergy automatically recalculates, including intraday
Forecast with P10, P50 and P90
For each plant or portfolio, with a dedicated model for wind, solar PV, CHP and storage
Residual quantity
Generation minus self-consumption and grid export
Schedule and trading system
Day-Ahead: in good time before the auction, via REST API or the standard exporter
We’d be happy to show you live how this works with your systems.
Features in mP Xnergy
What mP Xnergy does for renewable aggregators
mP Optimizer
More about mP Profiler
Selects the most appropriate model for each plant: wind is different from solar, and CHP is different from storage.
mP Simulator
More about mP Simulator
Simulates forecast accuracy and balancing energy costs before a new plant is added to the portfolio.
mP Scenario
More about Scenario
Generation scenarios from weather scenarios and Monte Carlo simulation: see the range your output is likely to fall within.
mP Profiler
More about mP Profiler
Sets up new wind farms and PV plants automatically, including batch import for portfolio acquisitions.
mP WebService
More about mP WebService
Sends all three curves to your trading system, ETRM and OMS in real time, with Python access.
mP Automation Server
Runs the entire process on a fixed schedule, with no manual intervention. With mP Workflow (add-on), it can also be event-driven.





See it in action
In about 30 minutes via Microsoft Teams: how the three scenarios are created, how to use them for selling your volumes and managing risk, and how quickly the forecast for your new assets becomes more accurate.